As a proud operator for Bitscrunch, ensuring the uptime and performance of your node is paramount. With the recent introduction of the new Bitscrunch endpoint, monitoring your node’s health has become even more streamlined and efficient. In this tutorial, we’ll guide you through the process of setting up Uptime Kuma to monitor your Bitscrunch node, allowing you to stay informed and proactive in maintaining the reliability of your services. Let’s dive in!
Install Uptime Kuma
First things first, ensure that you have Uptime Kuma installed on your system. You can easily install Uptime Kuma by following the instructions provided on their official website.
Configure Bitscrunch Endpoint
Once Uptime Kuma is installed, it’s time to configure the Bitscrunch endpoint.
Navigate to the settings section of Uptime Kuma and locate the option to add a new monitor.
Here, you’ll need to provide the URL of the Bitscrunch endpoint, which you can obtain from the Bitscrunch documentation or your node dashboard.
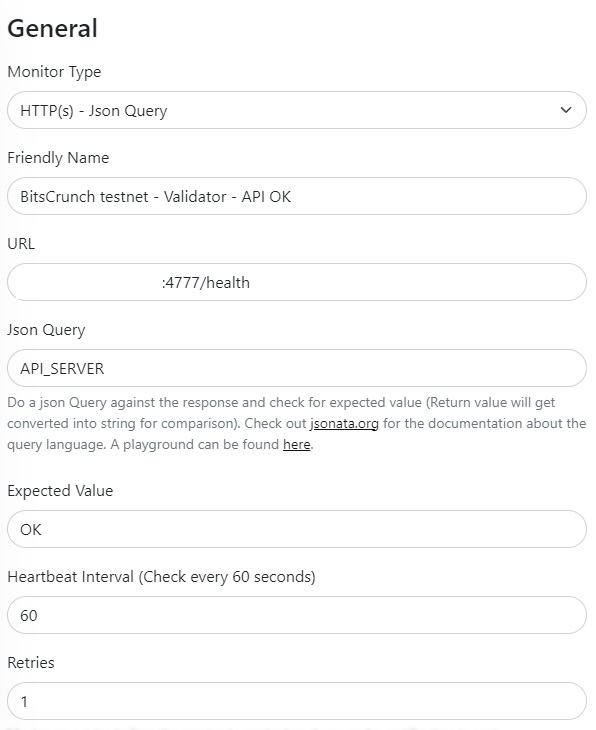
More in detail we configured two monitors:
The first one has the following configuration:
- Monitor type: HTTP(s) - Json Query
- URL: :4777/health
- Json Query: API_SERVER
- Expected Value: OK
The first one has the following configuration:
- Monitor type: HTTP(s) - Json Query
- URL: :4777/health
- Json Query: NODE_HEALTH
- Expected Value: OK
Next, set the monitoring parameters according to your preferences. You can specify the frequency of checks, alert thresholds, and notification preferences to ensure that you’re promptly notified of any issues with your node.
Test and Deploy
Before finalizing the configuration, it’s essential to test the monitor to ensure that it’s functioning correctly. Once you’re satisfied with the settings, deploy the monitor to start actively monitoring your Bitscrunch node.
With Uptime Kuma in place, you can now monitor the uptime and performance of your Bitscrunch node in real-time. Keep an eye on the dashboard to track metrics such as response times, uptime percentage, and any reported incidents.
In the event of any downtime or performance issues, take proactive steps to address the underlying cause promptly. Whether it’s troubleshooting technical issues or optimizing your infrastructure, swift action is key to minimizing downtime and ensuring the reliability of your node.
Conclusion
Before we conclude, we’d like to extend our heartfelt thanks to the Bitscrunch team for their continuous efforts in advancing blockchain technology and supporting operators like us. Your dedication to innovation and excellence is truly commendable, and we’re proud to be part of the Bitscrunch community.
Monitoring your Bitscrunch node with Uptime Kuma is a straightforward yet powerful way to ensure the reliability and uptime of your services. By following this step-by-step tutorial, you’ll be equipped with the tools and insights needed to proactively manage your node and provide a seamless experience for your users. Here’s to a future of uninterrupted service and continued success with Bitscrunch!